Secret Azure Debugging Tools
I recently stumbled on a blog post by Kevin Williamson that talks about a utility, used by Microsoft's internal support teams, that collects together a good selection of debugging tools in one package so you can do investigations over RDP on an Azure PaaS instance.
From that post:
- RDP to the instance
- Open a PowerShell console
- Paste and run the command
Import-Module BitsTransfer;

[string]$ToolsFolder = 'c:\tools'
[string]$ToolName = 'AzureTools.exe'
[string]$AzureToolsUrl = "http://dsazure.blob.core.windows.net/azuretools/$ToolName"

New-Item $ToolsFolder -Type directory -Force | Out-Null
Start-BitsTransfer $AzureToolsUrl "$ToolsFolder\$ToolName"
& "$ToolsFolder\$ToolName"
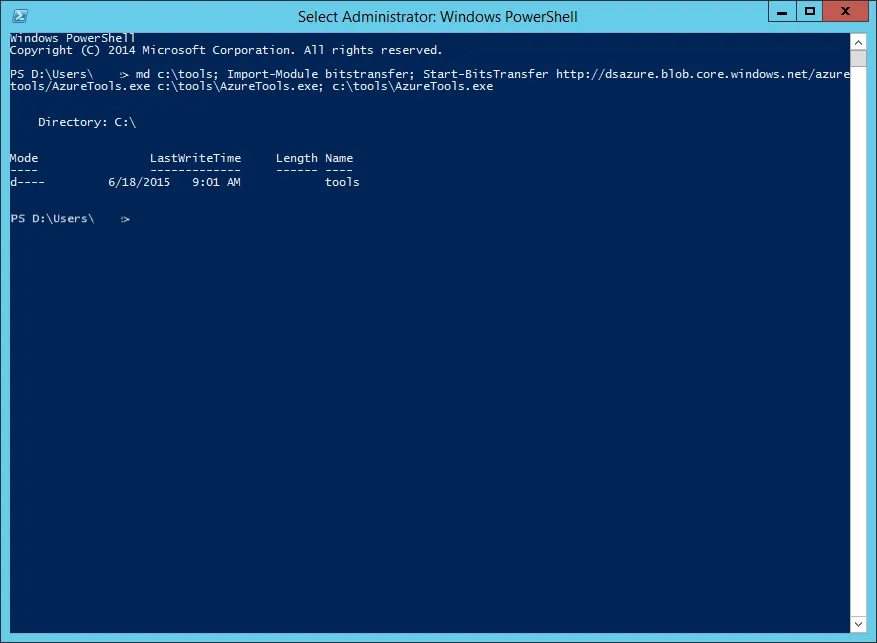
This should automatically start the AzureTools.exe and show the following UI:
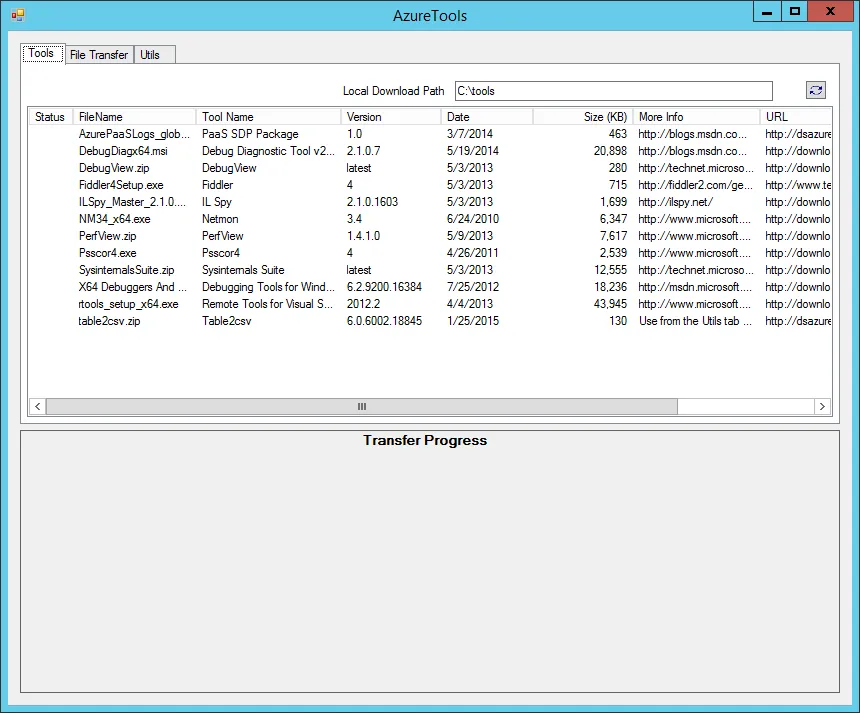
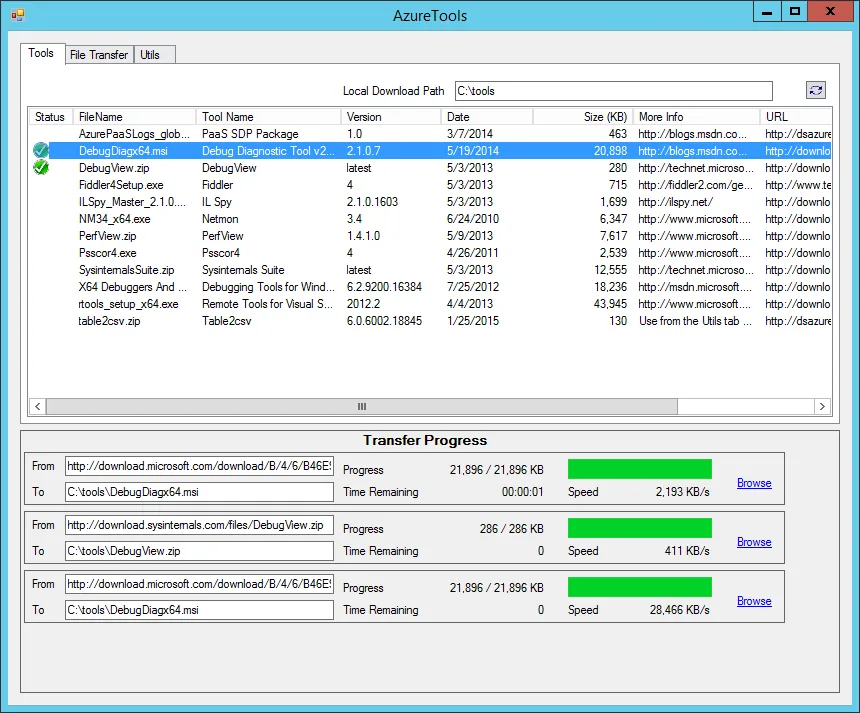
Clicking on one of the items in the Tools list will download and install that tool from the URL. Download progress is shown in the bottom half of the window:
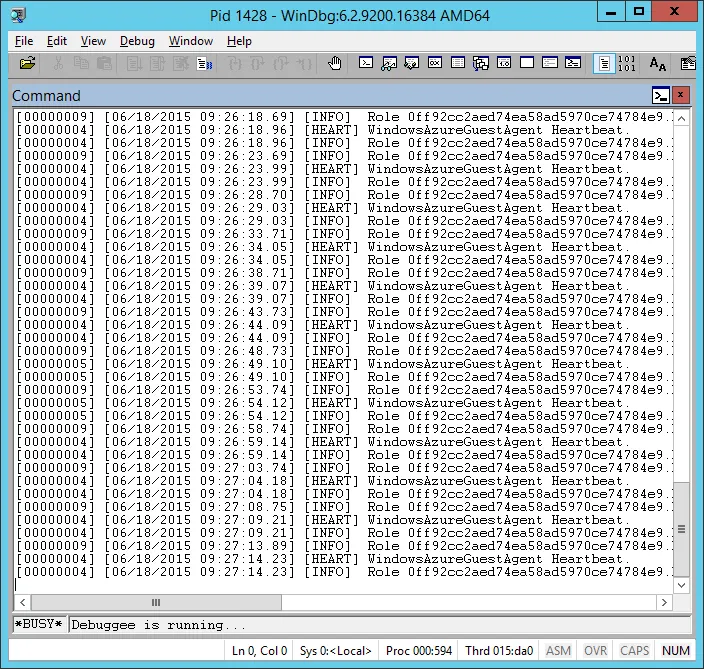
One of the most useful tools from the point of view of a developer trying to troubleshoot a worker role is using a debugger to attach to a process. Azure Tools comes with an installer for windbg (which for download and install is much better than a full Visual Studio install).
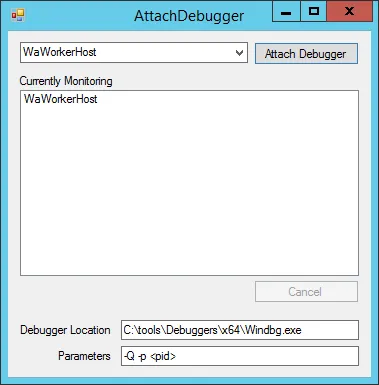
WaWorkerHost is the process responsible for hosting WebRole instances. When Windbg starts you get the full
capabilities of a debugger and a trace client for OutputDebugString calls.
Obviously, this is only just scratching the surface of all the goodness that the team have made available so I'm sure I will report back on other utilities as time goes on.
I'd also like to recommend Kevin's other posts in this series, particularly the troubleshooting scenarios: